
Orders & Costs
Slippage in Stock Trading: How to Measure and Control It
Your fill price and the price you saw are rarely the same. How to pick a reference price, calculate the gap in basis points, and which controls actually shrink it.
Slippage is the gap between the price you expected when you sent the order and the price you actually got. On a heavily traded large-cap it is usually a cent or two per share. On a thin name, during a fast tape, or with an order larger than the displayed size, it can cost more than the commission and the spread combined — and unlike those two, it never appears as a line item on your confirmation. You only find it by measuring.
Slippage is not the spread, and not the fee
Three costs get mixed up constantly:
- Commission or platform fee — a stated amount, visible before you trade.
- Spread — the distance between the best bid and the best offer at the moment you trade. Even a perfect fill at the offer costs you half the spread against the midpoint. That cost is predictable and is covered in detail in how liquidity sets your real trading cost.
- Slippage — the difference between your execution price and your chosen reference price. It exists because the quote moved between your click and the fill, or because your order was bigger than the size resting at the best price and had to walk up the book.
The practical consequence: a platform can quote you a tight spread and a low fee and still be expensive, if your orders routinely fill three cents behind the quote you saw.
You cannot measure slippage without picking a reference price
Every number changes depending on what you compare the fill to. Three common choices:
- Arrival midpoint — the midpoint of the national best bid and offer at the instant your order was entered. This is the cleanest benchmark for self-auditing, because it is neutral between buys and sells.
- Arrival quote on your side — the offer if you are buying, the bid if you are selling. This isolates the part of the cost that is not the spread.
- Decision price — the price when you decided to trade, which may be seconds or minutes before you acted. This captures hesitation cost as well as execution cost. Useful for reviewing your own behaviour, useless for judging a venue.
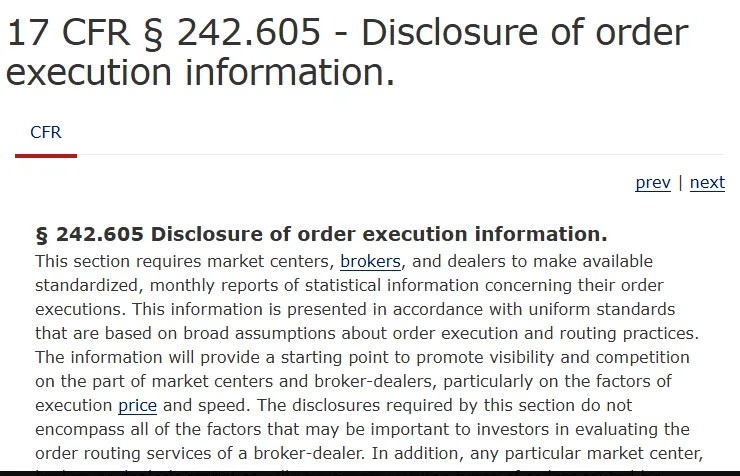
US regulators use a close cousin of the first one. Rule 605 of Regulation NMS requires standardized monthly reports of execution quality, including average effective spread, the ratio of average effective to average quoted spread, and the share-weighted average amount by which prices were improved relative to the best available displayed price.
That same rule sorts orders into size buckets — under $250, $250–$1,000, $1,000–$5,000, and so on up to $200,000 or more — which tells you something useful on its own: execution quality is expected to differ by order size. A statistic measured on $500 orders says little about a $40,000 one.
A worked example: 300 shares into 100 shares of depth
Take an illustrative quote, chosen to show the arithmetic rather than to report a recorded trade:
- Best bid 199.98, best offer 200.02, midpoint 200.00
- Only 100 shares displayed at the offer
- You send a market order for 300 shares
A plausible fill sequence:
| Shares | Price |
|---|---|
| 100 | 200.02 |
| 150 | 200.05 |
| 50 | 200.07 |
Average execution price = (100 × 200.02 + 150 × 200.05 + 50 × 200.07) ÷ 300 = 60,013.00 ÷ 300 = 200.0433
Now the two measurements:
- Against the arrival midpoint of 200.00: 0.0433 per share, $13.00 on the order, or 2.17 basis points.
- Against the offer you actually saw, 200.02: 0.0233 per share, $7.00. This second number is the part the spread does not explain.
Two things follow. First, a round trip roughly doubles the cost if you exit the same way, so budget about 4.3 bps, not 2.2. Second, the damage came from the 200 shares that had no displayed size behind them. Had you sent 100 shares, your slippage against the offer would have been zero.
What actually widens it
Depth at your size, not the headline spread. A one-cent spread with 100 shares on each side is thinner than a three-cent spread with 5,000 shares. Before sizing an order, look at the displayed size next to the price, not just the price.
The first and last minutes of the session. Opening and closing auctions concentrate volume, but the minutes around them carry the widest quotes of the day. Extended and overnight sessions are thinner still — if your platform offers them, the trade-off between access and execution cost is worth reading up on in the guide to stock trading hours and session types.
Scheduled and unscheduled news. Earnings releases, guidance updates, index inclusion, macro prints. Quotes widen before the event and stay wide for minutes afterwards.
Your order type. A market order buys certainty of execution and gives up certainty of price. A limit order does the reverse. The market versus limit order comparison goes through when each is the right call; for slippage specifically, the market order is where nearly all of it comes from.
Fractional and notional orders. When you buy "$200 of" something rather than a share count, the share quantity is derived from a price you do not control. Check which price the platform uses to convert, and when.
Auditing your own execution in one sitting
You do not need tooling for this. You need twenty trades and a spreadsheet.
- Before sending each order, note the time and the bid/offer you are looking at. A screenshot is fine.
- After the fill, pull the execution price and time from your trade history. If the order filled in several pieces, use the quantity-weighted average, not the first price.
- Compute slippage per share against the arrival midpoint, and separately against your side of the quote.
- Convert to basis points: slippage ÷ reference price × 10,000. This makes a $12 stock and a $600 stock comparable.
- After twenty trades, take the median, not the mean. One bad fill during an earnings gap will otherwise dominate the average and teach you nothing.
Then split the sample: market orders versus limit orders, first ten minutes versus midday, small orders versus large. The comparison that shows the biggest gap is the one worth acting on.
Controls that measurably help
- Use a marketable limit instead of a market order. Buying with a limit set a few cents above the offer keeps the speed of a market order but caps the worst case. You accept the risk of a partial fill in exchange for a known ceiling.
- Size against displayed depth. If you need more than is showing, plan to work the order rather than send it in one clip.
- Wait out the first five minutes unless the news is the reason you are trading.
- Split large orders across several smaller ones, and check the quote again between pieces.
- Read the execution quality disclosures your venue publishes. The 2024 amendments to Rule 605 (Release 34-99679, adopted 6 March 2024) extended the reporting obligation beyond market centers to larger broker-dealers and added a public summary report; the compliance date was pushed from 14 December 2025 to 1 August 2026 (Release 34-104147, 30 September 2025).
What the rules protect — and what they do not
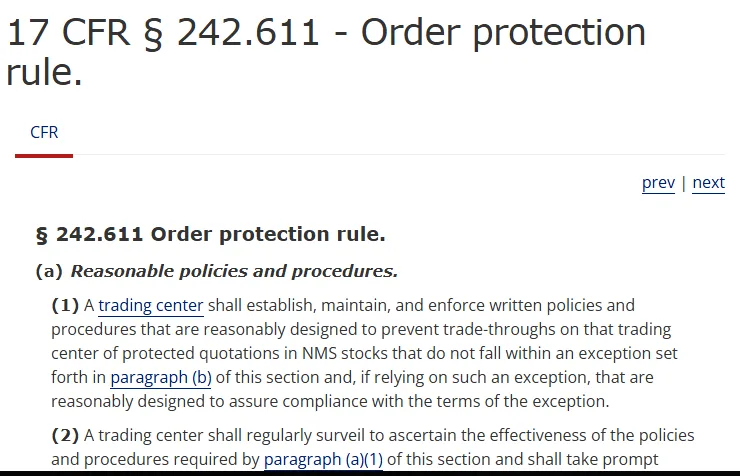
Rule 611 of Regulation NMS, the order protection rule, requires a trading center to "establish, maintain, and enforce written policies and procedures that are reasonably designed to prevent trade-throughs" of protected quotations in NMS stocks.
Read that carefully, because it is narrower than most people assume. Protected quotations are the best displayed bid and offer — the top of the book. The rule is designed to stop you being filled worse than the best displayed price while that price is available; it says nothing about the shares behind it. In the worked example above, every fill up to 200.07 can be entirely consistent with the rule.
Separately, FINRA Rule 5310(a)(1) requires a member to "use reasonable diligence to ascertain the best market for the subject security and buy or sell in such market so that the resultant price to the customer is as favorable as possible." The rule lists what diligence takes into account: the character of the market including price, volatility and relative liquidity; the size and type of transaction; the number of markets checked; accessibility of the quotation; and the terms and conditions of the order.
One limit matters especially on crypto-native platforms: these obligations attach to US-registered broker-dealers and trading centers. A tokenized or derivative product that tracks a share price is not necessarily filled inside that framework, and the entity on the other side of your order may be different from the one you think. Checking who executes and under what rules is part of the comparison between exchange-based stock access and traditional brokers.
Mistakes that distort the measurement
- Comparing the fill to the last trade print. The last print may be stale, or from the other side of the spread. Use the quote.
- Judging execution from one trade. Slippage is a distribution, not a number.
- Setting a limit so tight it never fills. An order that misses a move costs far more than five basis points. Opportunity cost is real cost.
- Reading a tight spread as deep liquidity. They are separate properties and often diverge on smaller names.
- Calling half the spread "slippage." If you take the offer and get the offer, you paid the spread, not slippage. Mislabeling it hides the part you could actually fix.
Sources
- 17 CFR § 242.605, Disclosure of order execution information (Legal Information Institute, Cornell Law School)
- 17 CFR § 242.611, Order protection rule (Legal Information Institute, Cornell Law School)
- FINRA Rule 5310, Best Execution and Interpositioning, including Supplementary Material .09
- SEC Release No. 34-99679 (6 March 2024) and Release No. 34-104147 (30 September 2025), on the Rule 605 amendments and the extended compliance date
Rule text and dates checked on 21 September 2026. Reporting obligations and compliance dates change; verify against the current rule before relying on them.