
Risk & Research
Position Sizing: How to Turn Risk per Trade Into a Share Count
Decide the loss first and let the share count follow. The division, a worked table of four trades, the second cap the formula does not give you, and what ten straight losses cost at 1% versus 10%.
Most people size a trade backwards. "Should I put $500 into this one?" fixes the amount of money and leaves the loss undefined — you find out how much was at stake only after the price moves. Reverse the order of the decisions: choose the loss you can absorb first, and let the share count fall out of the arithmetic.
Two numbers decide how many shares you buy
Everything below depends on exactly two inputs, and neither of them is your level of enthusiasm for the company.
The risk budget is the currency amount you accept losing if this particular idea is wrong. It is normally set as a small percentage of account equity — 1% of a $5,000 account is $50. It is a budget for being wrong, not a prediction that you will be.
The invalidation price is the price at which the reason you bought is no longer true: the support level that was supposed to hold, the price that no longer makes sense against earnings, the level below which your thesis has simply failed. It comes from the company and the chart. It is not the number that happens to feel affordable.
The gap between your entry price and that invalidation price is your risk per share. From there:
Shares = risk budget ÷ (entry price − invalidation price)
Round down to a whole share, never up. Rounding up quietly pushes you over the budget you just set.
The same $50 buys wildly different positions
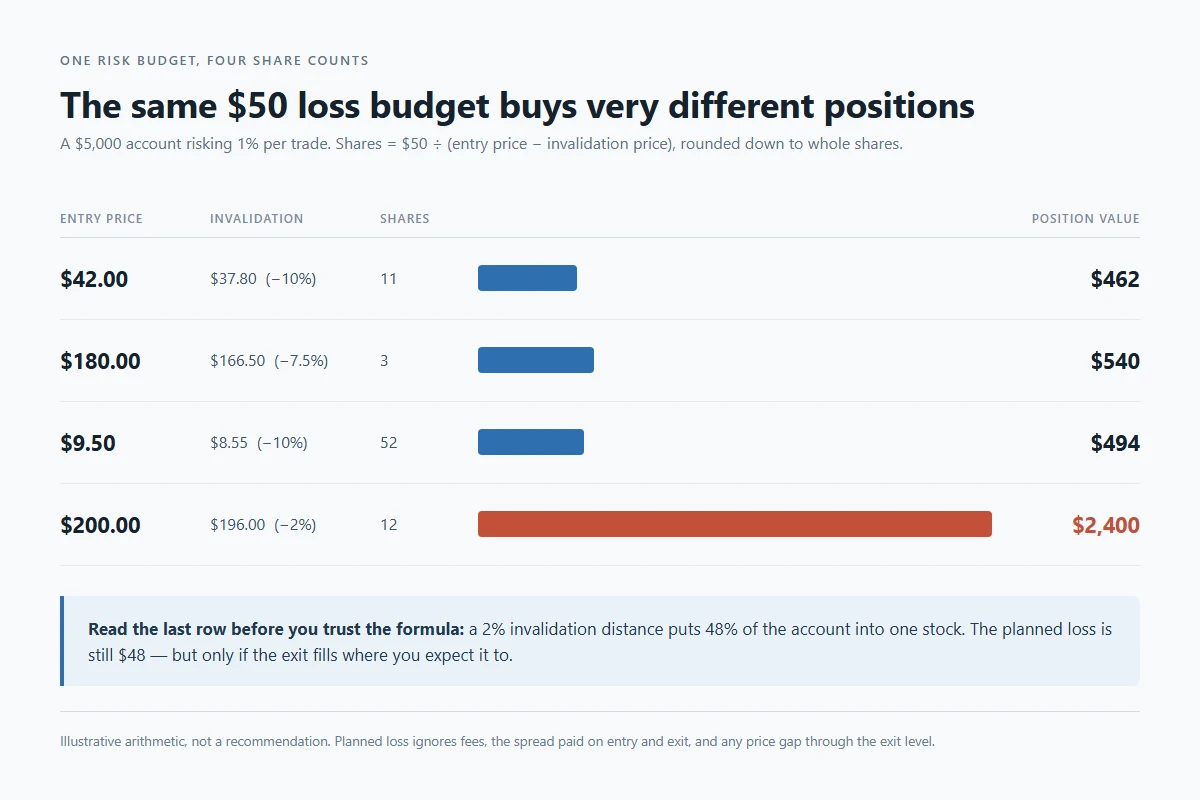
Four ideas, one account, one risk budget — and four position sizes that have nothing in common:
| Entry | Invalidation | Risk per share | Exact shares | Whole shares | Position value | Loss at exit |
|---|---|---|---|---|---|---|
| $42.00 | $37.80 (−10%) | $4.20 | 11.90 | 11 | $462 | $46.20 |
| $180.00 | $166.50 (−7.5%) | $13.50 | 3.70 | 3 | $540 | $40.50 |
| $9.50 | $8.55 (−10%) | $0.95 | 52.63 | 52 | $494 | $49.40 |
| $200.00 | $196.00 (−2%) | $4.00 | 12.50 | 12 | $2,400 | $48.00 |
Three of these positions land near $500 by coincidence, not design. The share price had almost nothing to do with it — a $9.50 stock and a $180 stock produced nearly the same exposure because their invalidation distances were similar in percentage terms. That is the point of sizing this way: the position adapts to where the exit sits.
Notice also what rounding down does. The $180 idea ends up risking $40.50 rather than $50, because three shares is as close as whole shares allow. On a platform that supports fractional share orders you can hit the budget more precisely, but the wasted budget is never the expensive error — the expensive one is rounding up to four shares and quietly running 8% over.
A tight exit is not permission to take a huge position
The last row is where beginners get hurt. A 2% invalidation distance makes the arithmetic offer you 12 shares — $2,400, or 48% of a $5,000 account, in a single name. The formula is satisfied. The planned loss really is $48.
But "planned" is doing heavy lifting there. The moment that position gaps through your exit on an earnings release, you are not losing 1% of the account, you are losing whatever the gap costs on $2,400 of stock. A 12% overnight gap is a $288 loss — six times the budget.
So every sizing formula needs a second, independent cap: a maximum percentage of the account in any single position, applied regardless of what the risk arithmetic says. Pick your own number and write it down before you need it. When the two rules disagree, the smaller position wins.
What the formula assumes, and what the market actually owes you
The arithmetic above silently assumes you will exit at your invalidation price. Nothing guarantees that.
If you plan to protect the position with a stop order, understand what it does: the stop price is a trigger, not a promised fill. FINRA's investor guidance on stop orders in volatile markets is blunt about it — "your stop order may be executed at a price that's significantly different from your stop price," and "rapid price movement during a short period of time could trigger a stop order," after which "the stock might later rebound and resume trading at its prior price level." A stop-limit order caps the price you accept but then carries the opposite risk: it may not execute at all.
Three more leaks between the arithmetic and your statement:
- The spread. You buy at the offer and exit at the bid, so a round trip pays the full quoted spread even with perfect execution. On thin names this is a real fraction of a small risk budget — how liquidity sets your real trading cost walks through the calculation.
- Fees. These matter in inverse proportion to your budget. If a round trip costs $0.70, that is 1.4% of a $50 budget — trivial. On a $500 account risking 1%, the same $0.70 eats 14% of a $5 budget before the trade has done anything.
- Settled cash. Sizing assumes the money is actually available. After a sale, US equity trades settle on a T+1 basis, which governs when proceeds can be withdrawn or redeployed; see when the money from a stock sale is actually available.
Count the risk you already have open
Position sizing done one trade at a time answers the wrong question if you hold six positions. Six open ideas at 1% each is 6% of the account at risk — and if four of them are the same sector reacting to the same interest-rate story, they are closer to one 4% bet than four independent ones.
Keep a running total of open risk: for each position, current price minus invalidation price, times shares held. Set a ceiling on the sum. When new ideas would breach it, either pass on them or reduce elsewhere first. This total is the number that decides how a bad week actually feels, and it is the piece a one-page risk plan exists to keep visible.
Why the percentage has to be small
Losing streaks are not hypothetical; they are what a sequence of independent outcomes looks like. Here is the compounded damage from ten consecutive losses, and what it then takes to get back to even:
| Risk per trade | Drawdown after 10 straight losses | Gain needed to recover |
|---|---|---|
| 1% | −9.6% | +10.6% |
| 2% | −18.3% | +22.4% |
| 5% | −40.1% | +67.0% |
| 10% | −65.1% | +186.8% |
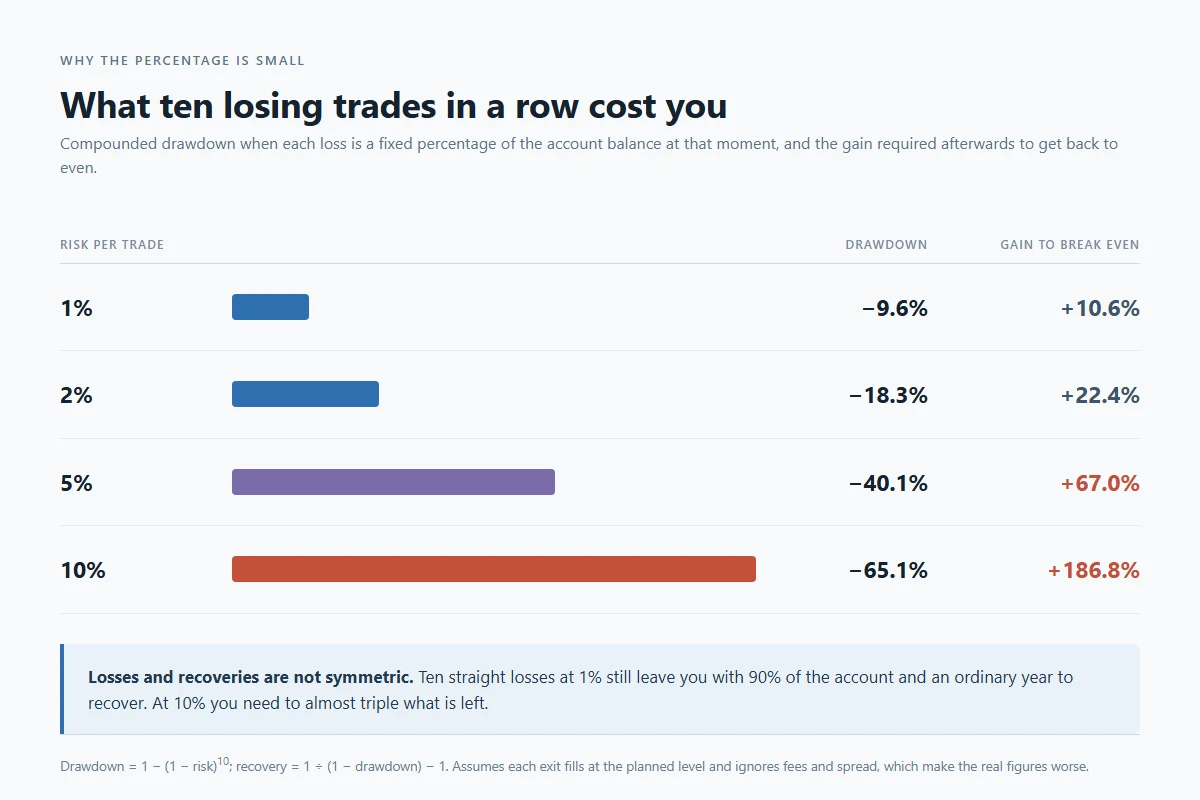
The asymmetry is the whole argument. At 1% you are down a tenth and an ordinary year repairs it. At 10% you have lost two-thirds of the account and need to almost triple what remains — while making decisions under the exact psychological pressure that produces more bad decisions.
Five ways this goes wrong in practice
- Sizing by conviction. "I'm sure about this one" is a feeling, not an input. Conviction belongs in whether you take the trade at all, not in how large it is.
- Moving the invalidation price after entry. Widening the exit once the price approaches it converts a planned $50 loss into an open-ended one. If the level was wrong, the position was wrong — close it and re-plan.
- Deriving the exit from the budget. Placing the exit wherever a comfortable position size requires puts it at a price the stock can reach on ordinary noise. The exit comes first; the size adapts.
- Calling an intention a stop. An exit level you intend to honour manually is only as good as your presence and nerve at that moment. Decide consciously which you are using.
- Sizing off the account balance you used to have. After a drawdown, 1% is 1% of what remains. Recalculate from current equity, which naturally shrinks position sizes during a bad run and grows them again as you recover.
Before you send the order
Four things should exist in writing: the invalidation price and the reason it is that price; the risk budget in currency; the share count from the division, rounded down; and a check that the position value clears your single-name cap and that the addition still fits your total open risk. If any one is missing, the order is not ready — the arithmetic takes about thirty seconds once you have the exit level, and the exit level is the part worth thinking about.
Sources
- FINRA, Stop Orders: Factors to Consider During Volatile Markets (published March 26, 2025; checked September 22, 2026).
- SEC Office of Investor Education and Advocacy, Investor Bulletin: Stop, Stop-Limit, and Trailing Stop Orders.
All dollar figures in this article are worked examples chosen to show the arithmetic. They are not recommendations, and they describe no specific stock.