
Risk & Research
ETF Due Diligence Checklist: Holdings, Fees and Tracking Difference
What to check before buying an ETF: holdings and concentration, the prospectus fee table, tracking difference against the index, premium/discount and median spread, fund size and distributions, worked through with the SPY prospectus.
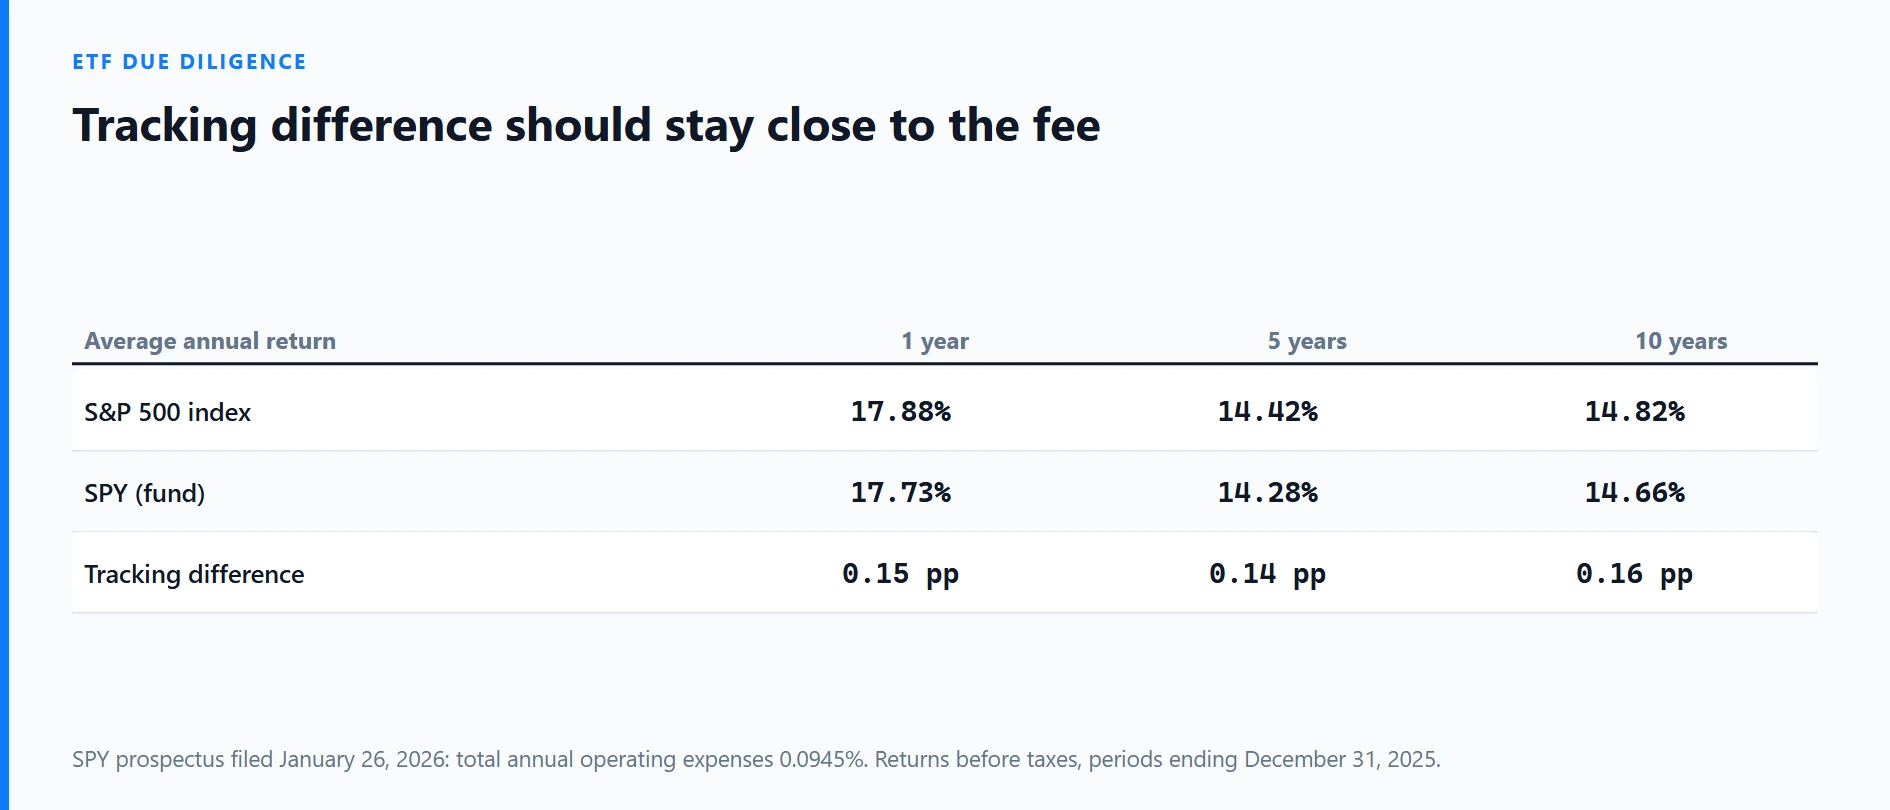
Two ETFs can track the same index and still leave you with different results. One charges more, one trails its index by a wider margin, one trades at a wide spread or drifts away from the value of what it holds. None of this shows up in the ticker or the fund name. It shows up in the prospectus, the fund's website and a few lines of the performance table.
This checklist goes through what to read before you buy an ETF, in the order that catches the most problems for the least time. The worked example uses the SPDR S&P 500 ETF Trust (SPY), because its prospectus shows every item clearly. Figures come from its prospectus filed with the SEC on January 26, 2026, checked on October 12, 2026. This is a method, not a recommendation for or against any fund.
Step 1: Confirm what the ETF actually holds
Start with the investment objective and the index. SPY's prospectus says the trust seeks results that "correspond generally to the price and yield performance of the S&P 500 Index", before expenses. That one sentence tells you three things: it is passive, it follows a named index, and expenses come on top.
Then open the full holdings list. Most U.S. ETFs registered as open-end funds must publish it every business day: SEC Rule 6c-11 requires the ticker, quantity and percentage weight of each holding to be posted on the fund's website before the market opens. Check:
- Top 10 weight. Add up the ten largest holdings. In a broad "500 stocks" fund, a large share of your money can still sit in a handful of companies.
- Sector weight. SPY's prospectus lists "Information Technology Sector Risk" as a principal risk because a significant portion of its assets is in that sector. If you already own the large technology names directly, a broad index fund adds more of the same exposure.
- Overlap with what you already own. Compare the top holdings with your existing positions. Owning two ETFs with the same top ten is not diversification.
If the fund holds swaps, futures or options instead of the shares themselves, read how that exposure is created. SPY's prospectus states that it "does not hold or trade futures or swaps". Leveraged and inverse ETFs are a separate product: they reset daily and can drift far from the index over longer periods, so their prospectus deserves a much closer read.
Step 2: Read the fee table, not just the headline expense ratio
Every prospectus has a fee table near the front. Here is SPY's:
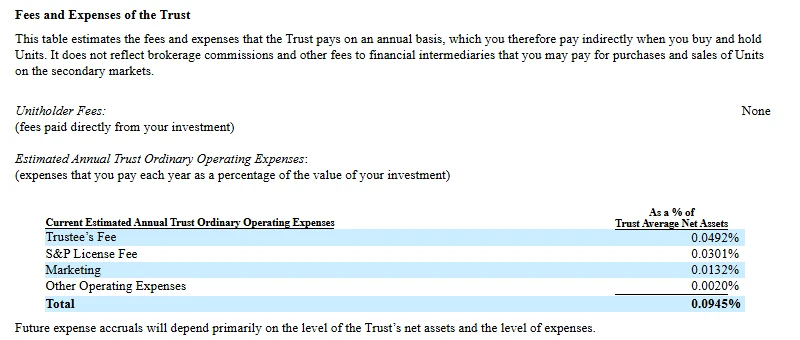
SPDR S&P 500 ETF Trust prospectus (Form 485BPOS, filed January 26, 2026), Fees and Expenses of the Trust.
How to read it:
- Total annual operating expenses: 0.0945%. On a $10,000 holding that is about $9.45 a year, taken from the fund's assets rather than billed to you. You never see the deduction; it is already in the price.
- What is not included. The text above the table says it "does not reflect brokerage commissions and other fees" you pay when buying and selling. Your platform's commission and the bid-ask spread are extra.
- Fee waivers. Some funds show a gross expense ratio and a lower net ratio after a waiver. Check the waiver's end date in the footnote; the lower figure may be temporary.
- Portfolio turnover. SPY reports turnover of 3% in its latest fiscal year. Trading costs inside the fund are not part of the expense ratio, so high turnover is a hidden cost. Index funds usually turn over little; active or thematic ETFs can turn over much more.
Step 3: Measure tracking difference from the performance table
The expense ratio is what the fund says it charges. Tracking difference is what you actually gave up compared with the index. Find it in the "Average Annual Total Returns" table:
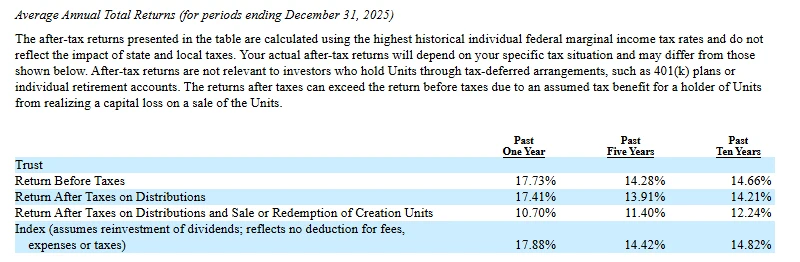
Subtract the fund's "Return Before Taxes" from the index row:
| Period | SPY | S&P 500 | Gap per year |
|---|---|---|---|
| 1 year | 17.73% | 17.88% | 0.15 pp |
| 5 years | 14.28% | 14.42% | 0.14 pp |
| 10 years | 14.66% | 14.82% | 0.16 pp |
The gap is slightly larger than the 0.0945% expense ratio. That is normal: trading costs, cash waiting to be invested and the timing of dividends all add a little. What you are looking for is consistency. A gap that stays near the expense ratio across all three periods means the fund is doing its job. A gap several times the expense ratio, or one that swings widely from period to period, needs an explanation.
Small numbers compound. Using the ten-year figures, $10,000 growing at 14.82% a year becomes about $39,827; at 14.66% it becomes about $39,275. The difference is roughly $550, almost all of it from that 0.16-point annual gap.
Two caveats from the prospectus itself. The index row "reflects no deduction for fees, expenses or taxes", so a fund can never match it exactly. And SPY provides no dividend reinvestment service, so your own return depends on what you do with the quarterly cash.
Tracking error is a different measure: the volatility of the daily or monthly differences, not the average gap. Many fund websites publish it. A small tracking difference with high tracking error means the fund ends up close to the index on average but wanders in between.
Step 4: Check premium, discount and the spread you will pay
An ETF has two prices: the net asset value (NAV) of its holdings, and the market price at which you trade. Large institutions keep them close by creating and redeeming shares in big blocks; SPY's prospectus calls these "Creation Units" of 50,000 units. When that mechanism works, the gap is tiny. When markets are stressed or the holdings are hard to trade, it can widen.
Rule 6c-11 requires most ETFs to publish on their website, each business day:
- the previous day's NAV, market price and premium or discount;
- a table of how many days the fund traded at a premium or a discount over the last calendar year and recent quarters;
- the median bid-ask spread over the last 30 calendar days, as a percentage;
- a statement if the premium or discount has exceeded 2% for more than seven consecutive trading days.
SPY is organized as a unit investment trust rather than an open-end fund, so it falls outside that rule's definition of an ETF; check its sponsor's fund page for the equivalent pricing data. For any ETF, compare the median spread with your own order size. On a 0.05% spread, a $2,000 buy costs about $1 in spread on the way in, and again on the way out. Our guide to bid-ask spreads and real trading costs shows how to measure the spread at the moment you trade.
Practical rules that follow:
- Use a limit order rather than a market order, especially for thinly traded ETFs.
- Avoid the first and last minutes of the regular session, when spreads on many ETFs are widest.
- Be careful with ETFs holding foreign stocks while their home market is closed: the ETF keeps trading, but the NAV is based on stale prices.
Step 5: Look at size, age and closure risk
Funds with small assets and low trading volume are more likely to close. A closure does not wipe out your money, but the fund sells its holdings and pays out cash, which can create a taxable event at a time you did not choose. Note the fund's net assets, inception date and average daily volume on the fund page. A very new fund may not have enough history for the Step 3 comparison at all.
Step 6: Understand distributions and taxes for your situation
Read how often the fund pays dividends and how they are taxed. SPY pays quarterly, on the last business day of April, July, October and January. Its tax section is written for U.S. holders; if you live elsewhere, withholding tax, reporting duties and how your jurisdiction treats foreign funds follow your local rules. Keep each distribution statement. Our currency, dividend and tax checklist lists the records worth keeping.
The checklist in one place
- Objective and index: passive or active, which index, any derivatives or leverage.
- Holdings: top-10 weight, largest sector, overlap with what you already own.
- Fee table: total expenses, waivers and their end date, turnover.
- Tracking difference: fund minus index over 1, 5 and 10 years, compared with the expense ratio.
- Trading: median bid-ask spread, premium and discount history, volume at the times you trade.
- Size and age: net assets, inception date, closure risk.
- Distributions and tax: payment schedule, withholding, records.
Common mistakes
- Choosing on expense ratio alone. A fund with a slightly higher ratio but a smaller tracking gap and tighter spread can cost less overall.
- Treating the ETF name as a description. "Global", "dividend" or "innovation" in a name says little about the actual weights. The holdings file does.
- Reading one year of performance. A single year can hide a temporary problem or a one-off gain. Use every period in the table.
- Ignoring the spread on small orders. For small, frequent trades, the spread can easily cost more than a year of fund expenses.
Sources (checked October 12, 2026): SPDR S&P 500 ETF Trust prospectus, Form 485BPOS filed January 26, 2026 (Summary: Fees and Expenses of the Trust; The Trust's Investments and Portfolio Turnover; Principal Risks; Trust Performance; Dividends; Redemption of Units), via SEC EDGAR; 17 CFR 270.6c-11, paragraph (c)(1).