
Risk & Research
P/E, PEG and Free-Cash-Flow Yield: When Each Metric Helps
What P/E, PEG and free-cash-flow yield each measure, when each one misleads, and a five-step routine to calculate them, worked through with Apple's fiscal 2025 10-K figures.
A P/E of 33 tells you very little on its own. It could be expensive, fair or cheap depending on how fast earnings grow, how much of those earnings turn into cash, and whether the "E" in the ratio was distorted by a one-off item. P/E, PEG and free-cash-flow yield each answer a different question, and each breaks in a predictable way. This guide works through all three with one real set of numbers so you can see where they agree and where they pull apart.
The three questions behind the three ratios
| Metric | Formula | Question it answers |
|---|---|---|
| P/E | Share price ÷ earnings per share (EPS) | How many years of current accounting profit am I paying for? |
| PEG | P/E ÷ expected annual EPS growth (in %) | Is that multiple reasonable for the growth I expect? |
| FCF yield | Free cash flow per share ÷ share price | What cash return does the business generate on today's price? |
Free cash flow (FCF) here means cash from operations minus capital expenditure. It is not a line item under US GAAP, so you calculate it yourself from the cash flow statement.
One worked example: Apple's fiscal 2025 figures
All inputs below come from Apple's Form 10-K for the fiscal year ended September 27, 2025 (filed with the SEC, checked on 2026-10-05). The share price is an assumed $250 used only to make the arithmetic concrete. It is not a quote; plug in the current price when you repeat the exercise.
From the income statement and cash flow statement:
- Diluted EPS: $7.46 (2025), $6.08 (2024), $6.13 (2023)
- Diluted shares: 15,004,697 thousand (2025)
- Cash generated by operating activities: $111,482 million
- Payments for property, plant and equipment: $12,715 million
- Share-based compensation expense: $12,863 million
P/E
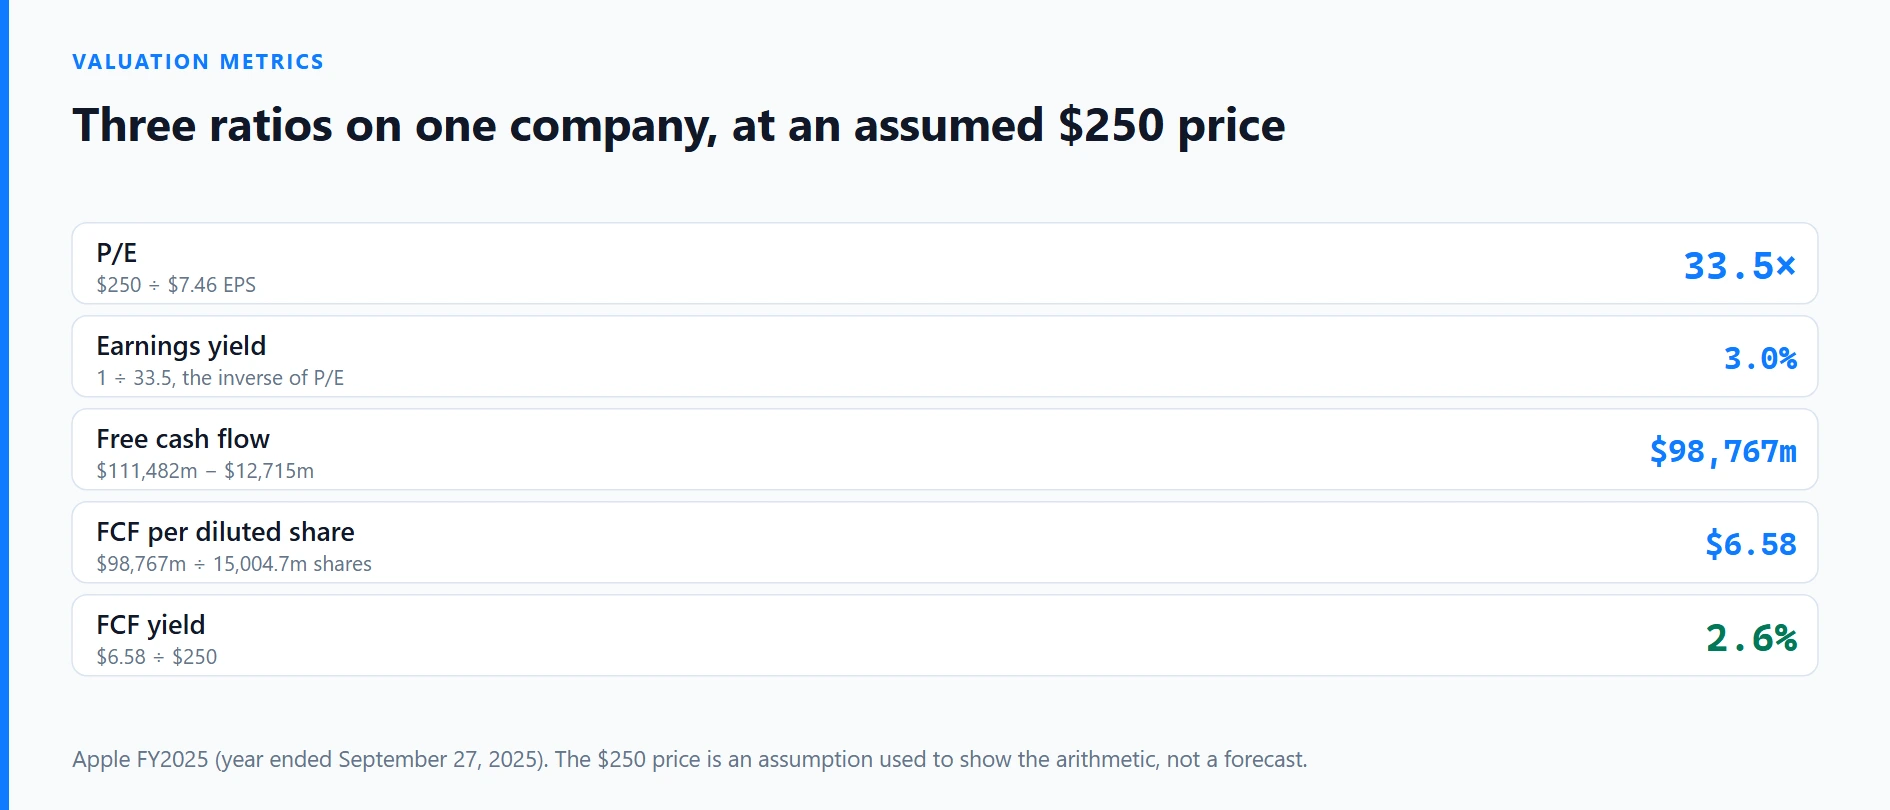
$250 ÷ $7.46 = 33.5×. The inverse, the earnings yield, is 1 ÷ 33.5 ≈ 3.0%.
PEG, and why the growth window matters
PEG needs a growth rate, and the choice changes the answer dramatically:
- One-year growth, 2024 to 2025: $7.46 ÷ $6.08 − 1 = 22.7%. PEG = 33.5 ÷ 22.7 ≈ 1.5.
- Two-year compound growth, 2023 to 2025: ($7.46 ÷ $6.13)^0.5 − 1 ≈ 10.3%. PEG = 33.5 ÷ 10.3 ≈ 3.3.
Same company, same price, a PEG of 1.5 or 3.3. The 2024 base year was depressed: Apple recorded a one-time income tax charge of about $10.2 billion that year related to the European Commission's State Aid decision, which pulled 2024 EPS below 2023. Measuring growth from a dented base flatters the one-year figure. We walk through that charge in our guide to cash flow versus profit.
The popular "PEG below 1 is cheap" rule of thumb assumes the growth number is clean and sustainable. Taken from a single year, it rarely is.
FCF yield
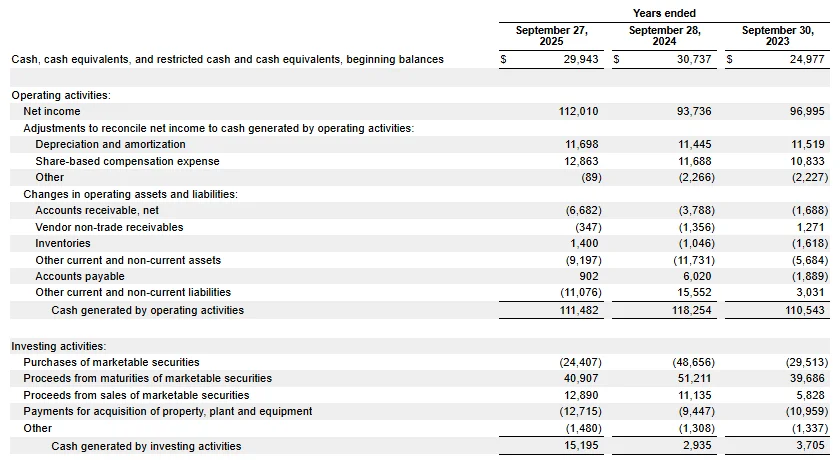
FCF = $111,482m − $12,715m = $98,767m. Per diluted share: $98,767m ÷ 15,004.7m ≈ $6.58. FCF yield = $6.58 ÷ $250 ≈ 2.6%.
Many stock screeners skip one adjustment. Share-based compensation is added back in operating cash flow because it is non-cash, yet shareholders pay for it through dilution or through the buybacks used to offset it. Subtract it and FCF falls to $85,904m, about $5.73 per share, for a yield of roughly 2.3%.
Reading the three together
Earnings yield 3.0%, FCF yield 2.6% (2.3% after stock compensation), PEG anywhere from 1.5 to 3.3. They agree on one point: at $250 you would be paying for growth that has not shown up in the figures yet. The disagreement tells you what to research next. Here, that is what normal EPS growth looks like once the 2024 tax charge is set aside.
When each metric helps, and when it misleads
P/E works when
- Earnings are positive, recurring and not dominated by one-off items.
- You compare companies in the same industry with similar accounting, such as two retailers or two software firms.
- You compare a company with its own history, using the same EPS definition each year.
It misleads when net income includes large gains or charges, when a company is cyclical (P/E often looks lowest at the top of the cycle, when earnings are temporarily high), or when earnings are close to zero and the ratio explodes.
PEG works when
- The company has a steady growth record over several years.
- You can say where your growth figure comes from: trailing multi-year EPS, or your own estimate with a reason behind it.
It misleads when growth is measured from a depressed or inflated base year, when the growth rate is a short-term spike, or when growth is negative and the ratio stops meaning anything. It also ignores how much capital the growth consumes.
FCF yield works when
- The business converts profit to cash reliably and capital spending is a meaningful part of the story.
- You want to set a stock's cash return against bond yields or the cost of buying back shares.
- You suspect accruals are inflating earnings. Cash is harder to dress up, as our 10-K red-flags guide explains.
It misleads when one year has unusual working-capital swings, when a company cuts investment to make cash flow look better, or when large share-based compensation is ignored. Average FCF over three years before trusting the yield.
A five-step routine you can repeat
- Pull three years of data from the 10-K: diluted EPS, diluted shares, operating cash flow, capital expenditure and share-based compensation. Our walkthrough of SEC EDGAR shows where each filing lives.
- Scan for one-offs in the notes and MD&A: tax settlements, impairments, gains on asset sales. Note the amount and the year.
- Calculate P/E on the current price, then again with the one-off removed if it is material.
- Calculate PEG with a multi-year growth rate and write down the window you used. If the one-year and multi-year PEG differ by more than about half, treat the one-year figure as unreliable.
- Calculate FCF yield twice, with and without share-based compensation, and compare it with the earnings yield. An FCF yield well below the earnings yield year after year is a reason to dig into receivables, inventory and capital spending.
Mistakes that skew the numbers
- Mixing EPS definitions. Data sites show trailing GAAP EPS, "adjusted" EPS or forward analyst estimates. A forward P/E of 28 and a trailing P/E of 33 can describe the same stock on the same day.
- Using basic instead of diluted shares. Diluted counts include in-the-money options and restricted stock units, which matters for companies that pay heavily in stock.
- Treating a ratio as a verdict. A low P/E can be a value trap if earnings are about to fall. None of these ratios forecasts anything; they describe what today's price implies.
- Comparing across sectors. Banks, utilities and software firms carry structurally different multiples and capital needs. Compare within an industry.
Limits
All three ratios rest on historical or estimated figures and a price that moves every second. The Apple numbers above come from one filing and an assumed price: they illustrate the method and say nothing about whether the shares are worth buying. Figures change with each new 10-K, so re-pull them instead of reusing a saved table.
Source (checked 2026-10-05): Apple Inc. Form 10-K for the fiscal year ended September 27, 2025 (Consolidated Statements of Operations, Consolidated Statements of Cash Flows and the income taxes note), available through the SEC's EDGAR company search.