
Risk & Research
Cash Flow vs Profit: How to Judge the Quality of Earnings
How to compare net income with operating cash flow: the cumulative cash conversion ratio, the accrual gap, receivables and inventory checks, and free cash flow after stock compensation, worked through with Apple's fiscal 2023–2025 figures.
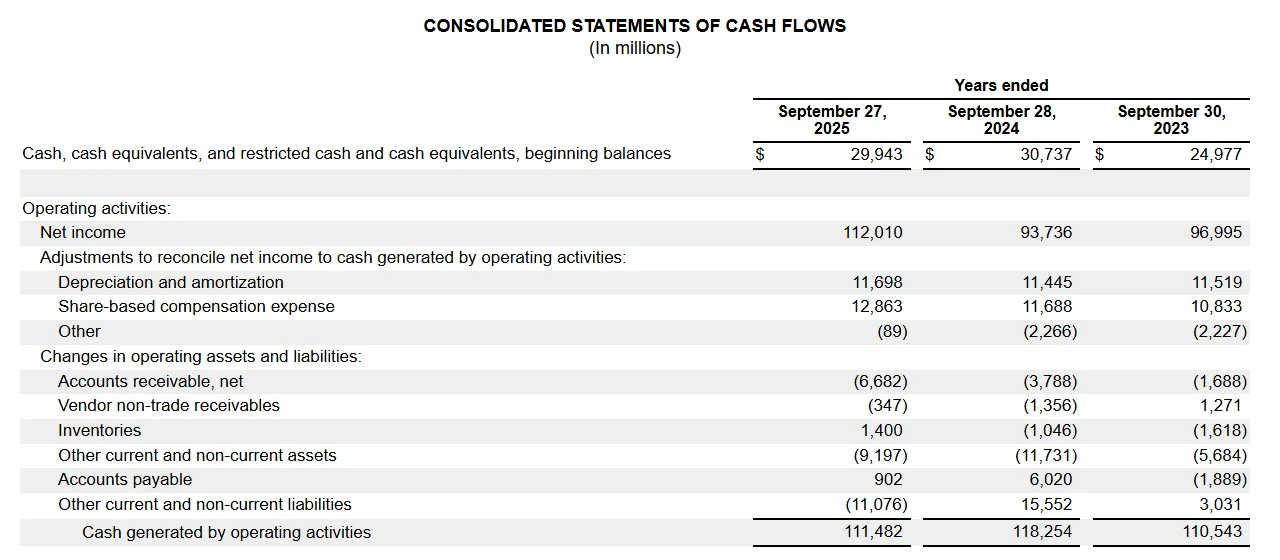
Net income is an opinion; cash is a fact. That line gets quoted a lot, and it is only half right. Net income is built on accrual accounting: revenue is recorded when it is earned and expenses when they are incurred, whether or not money has moved. That is usually the more accurate picture of a year's performance. The cash flow statement then shows how much of that profit actually arrived as cash, and the gap between the two is where the useful questions are.
This guide explains how to compare the two numbers, which ratios to calculate, what a normal gap looks like and which patterns deserve a closer look. All figures come from Apple's fiscal 2025 Form 10-K, because a large, well-documented filing makes it easy to check every step yourself.
Why profit and operating cash flow differ
The operating section of the cash flow statement starts with net income and walks it back to cash in two groups of adjustments. The SEC's Beginners' Guide to Financial Statements describes this as reconciling net income to "the actual cash the company received from or used in its operating activities."
Non-cash charges added back. Depreciation, amortization and share-based compensation reduced profit but used no cash in the year. They are added back.
Changes in working capital. If customers owe the company more at year-end than at the start, some revenue was booked but not collected, so the increase in receivables is subtracted. Inventory that was bought but not yet sold is also subtracted. Unpaid bills to suppliers work the other way: a rise in payables means expenses were booked but cash has not left yet, so it is added.
Once you can read those two groups, you can tell whether a gap comes from normal business mechanics or from something that should make you slow down.
The worked example: Apple, fiscal 2023–2025
Here is the operating section as filed:
| Fiscal year (US$ millions) | 2025 | 2024 | 2023 |
|---|---|---|---|
| Net income | 112,010 | 93,736 | 96,995 |
| Cash generated by operating activities | 111,482 | 118,254 | 110,543 |
| Operating cash flow ÷ net income | 1.00 | 1.26 | 1.14 |
Over the three years combined, operating cash flow was $340.3 billion against net income of $302.7 billion — a ratio of about 1.12. For a mature company with large depreciation and stock-compensation add-backs, a ratio a little above 1 over several years is the normal pattern.
The single year that looks odd is 2024, where cash ran 26% ahead of profit. A ratio that high could be read as a sign of strength, or as a sign that 2025 would give some of it back. The notes explain which.
A one-year gap that the notes explain
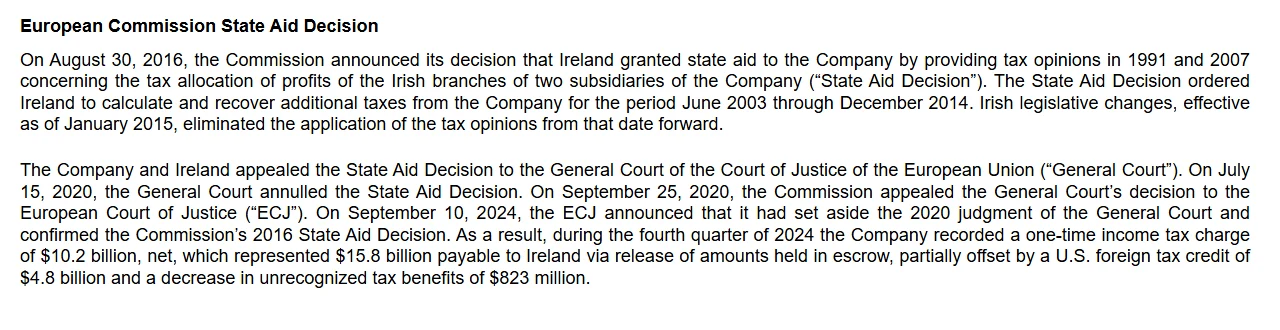
Note 7, "Income Taxes", rendered from Apple's FY2025 10-K on SEC EDGAR. The charge hit fiscal 2024 profit; the payment came from escrow afterwards.
In September 2024 the EU Court of Justice upheld the European Commission's 2016 State Aid Decision, and Apple booked a one-time income tax charge of $10.2 billion, net, in the fourth quarter of fiscal 2024. That charge lowered 2024 net income, but the money was paid to Ireland out of escrow later. Two lines in the 2025 filing are consistent with that timing:
- income taxes payable on the balance sheet fell from $26.6 billion to $13.0 billion;
- cash paid for income taxes rose to $43.4 billion in 2025, from $26.1 billion in 2024, while the 2025 income tax expense was $20.7 billion.
Add the $10.2 billion back to 2024 net income and the ratio drops from 1.26 to about 1.14 — the same level as 2023. In 2025, cash ran slightly below profit, partly because the tax that had been expensed in 2024 was now being paid. Neither year on its own tells the story; the two together do.
This is the practical reason to compare several years. A ratio in any single year can be pushed around by the timing of a tax payment, a large customer prepayment or an unusual supplier arrangement. Over three to five years those timing effects largely cancel out, and what is left shows how much of reported profit actually turns into cash.
Four checks to run on any company
1. Operating cash flow ÷ net income, over three to five years
Add up net income and operating cash flow for the period and divide. Around 1 or above for a profitable, mature company is normal. A ratio persistently well below 1 means profit is running ahead of cash year after year. Before drawing any conclusion, find the working-capital line that explains the gap.
2. The accrual gap relative to the balance sheet
Analysts often scale the difference by total assets: (net income − operating cash flow) ÷ average total assets. For Apple's 2025: (112,010 − 111,482) ÷ the average of $359.2 billion and $365.0 billion ≈ 0.15%. That is effectively zero. A company where this figure stays at several percent of assets, positive, year after year, is reporting profit that the balance sheet is absorbing as receivables, inventory or capitalized costs rather than cash.
3. Receivables and inventory against sales
Compare the growth of accounts receivable with revenue growth, or convert it to days sales outstanding (receivables ÷ revenue × 365).
Apple's own numbers show why this is worth doing even for a clean company. Net sales grew 6.4% in 2025 ($391.0 billion to $416.2 billion) while net accounts receivable grew 19.1% ($33.4 billion to $39.8 billion). Days sales outstanding moved from about 31.2 to 34.9 days. One year of that is not a warning. It is a question to carry into the next 10-Q: does collection time go back down, or keep rising?
Here is what the pattern looks like when it is a problem. The figures below are invented for illustration, not taken from any company. A company reports net income of $50 million, and its receivables rise by $40 million while revenue grows 5%. Operating cash flow ends up near $10 million plus depreciation. If that repeats for two or three years, the company may be booking sales that customers are slow to pay, or offering longer credit terms to hit revenue targets. The 10-K usually shows the trail: the allowance for credit losses, the revenue recognition note, and MD&A comments on collections.
Inventory works the same way. Inventory rising much faster than cost of sales can mean products are not selling, and a later write-down would hit profit.
4. Free cash flow, before and after stock compensation
Free cash flow is operating cash flow minus capital expenditure. Apple 2025: 111,482 − 12,715 = $98.8 billion, about 88% of net income. Capex ($12.7 billion) was slightly above depreciation and amortization ($11.7 billion), which is what you would expect from a business that is maintaining and modestly growing its asset base.
Many companies' free cash flow looks better than it should because share-based compensation is added back as "non-cash." It is still a real cost to shareholders, paid in new shares instead of cash. Apple added back $12.9 billion in 2025; subtract it and free cash flow falls to about $85.9 billion. For a company that pays heavily in stock and never buys shares back, this adjustment can wipe out most of its reported free cash flow.
Patterns that inflate operating cash flow
The gap can also mislead in the other direction. Operating cash flow can be made to look stronger than the business really is:
- Stretching suppliers. A big rise in accounts payable adds to operating cash flow once, but the company cannot keep paying suppliers later every year. Check payables growth against cost of sales.
- Supplier finance programs. Under FASB ASU 2022-04, companies that use supplier finance (reverse factoring) must disclose the program's key terms and the outstanding amount. If these obligations are growing fast, part of the operating cash flow depends on a financing arrangement.
- Selling receivables. Factoring receivables brings cash in early. The sale is often shown as an operating inflow even though it is closer to financing.
- Capitalizing costs. Costs recorded as assets (software development, contract costs) move into investing cash flow, which lifts operating cash flow. Compare this with how the company's peers account for similar spending.
None of these practices is improper in itself. What you are checking is whether the cash flow trend still holds after you remove them.
Common mistakes
- Judging one year. A single year is easily distorted by timing, as Apple's 2024 tax charge shows.
- Assuming cash above profit is always good. It can come from stretched payables or from a charge that will be paid in cash next year.
- Ignoring stock compensation. "Free" cash flow that depends on paying staff in shares is not all available to shareholders.
- Stopping at the ratio. The ratio tells you where to look; the working-capital lines and notes tell you why.
A five-minute routine
- Put three to five years of net income and operating cash flow side by side and calculate the cumulative ratio.
- Find the largest working-capital line in each year and see whether it reverses.
- Compare receivables and inventory growth with sales and cost of sales.
- Calculate free cash flow, then subtract share-based compensation.
- Search the notes for one-off items (tax settlements, legal charges, asset sales) that explain any unusual year.
If profit and cash stay close over several years, the earnings are backed by cash. That still does not tell you whether the share price is reasonable. For the wider research process, see how to research a stock with SEC EDGAR; for the warnings a filing is required to disclose, see reading a 10-K for red flags. A weak cash conversion ratio is also a reason to keep any position small, as set out in our beginner stock trading risk plan.
Sources
- Apple Inc., Form 10-K for the fiscal year ended September 27, 2025: consolidated statements of operations, balance sheets and cash flows; Note 7, Income Taxes.
- SEC, Beginners' Guide to Financial Statements.
- FASB, Accounting Standards Update 2022-04, Liabilities—Supplier Finance Programs (Subtopic 405-50): Disclosure of Supplier Finance Program Obligations.
Figures were checked against the filing on September 29, 2026. All ratios were calculated from the reported statements and rounded. Apple is used as a worked example only; nothing here is a view on its shares.