
Risk & Research
How Concentrated Is My Portfolio? Measuring Single-Stock and Industry Exposure
Three spreadsheet numbers that show real concentration: look-through company weights, industry totals and the effective number of holdings, worked through with SPY's March 2026 holdings and a 50% SPY plus three-stock example.
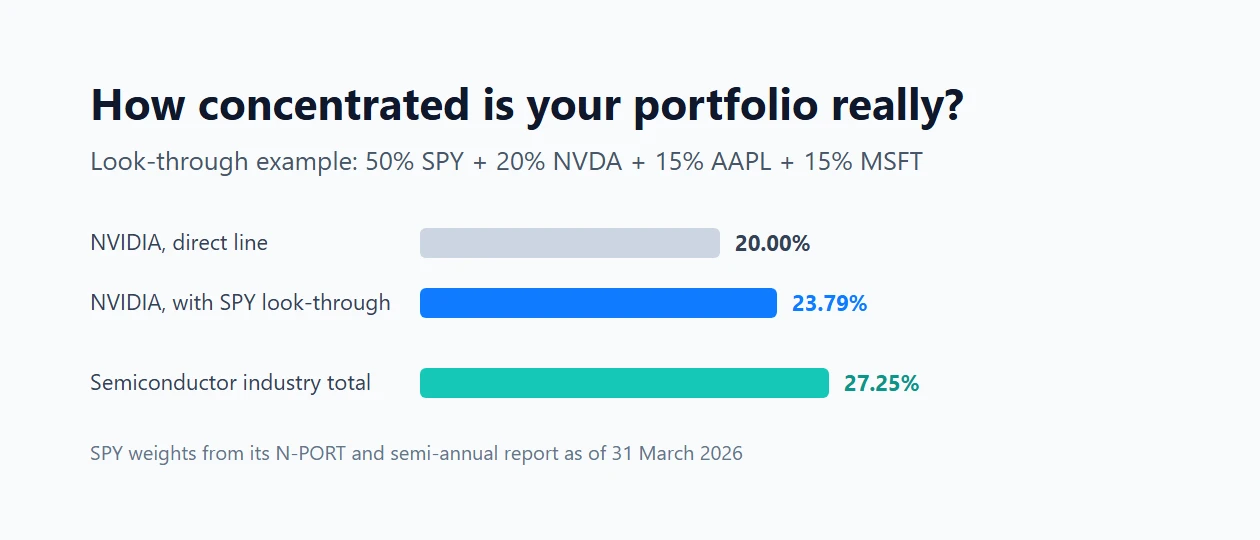
Owning four or five tickers can feel diversified. The question that matters is different: if one company or one industry has a bad year, how much of your account moves with it? This guide shows three numbers you can calculate in a spreadsheet to answer that, and why you have to look inside your ETFs before you trust any of them.
The worked example uses the SPDR S&P 500 ETF Trust (SPY), because its holdings are published in SEC filings that anyone can download. The portfolio in the example is illustrative, not a recommendation.
Step 1: List every position by issuer, not by ticker
Start with a plain list: position, market value, and weight (market value divided by the account total, including cash).
Then merge anything that is the same company. Alphabet has two listed share classes, GOOGL and GOOG. In SPY's March 31, 2026 portfolio report on Form N-PORT they appear as two lines, at about 3.0% and 2.4%, but they are one business: together 5.39% of the fund. If you hold both classes, or a stock plus its ADR, count them as one issuer.
Step 2: Look through your ETFs
An ETF line in your account is not one position. It is a slice of every company the fund holds. To see your real exposure to a company, add your direct holding to your share of the fund's holding:
Look-through weight = direct weight + (ETF weight in your account × company weight inside the ETF)
Fund weights come from the fund's own filings or its website holdings file. For SPY as of March 31, 2026 (Form N-PORT, 503 holding lines, 500 issuers after merging share classes):
| Issuer | Weight in SPY |
|---|---|
| NVIDIA | 7.58% |
| Apple | 6.66% |
| Alphabet (both classes) | 5.39% |
| Microsoft | 4.91% |
| Amazon | 3.64% |
| Top 10 issuers combined | 37.90% |
Now take an example account: 50% SPY, 20% NVIDIA, 15% Apple, 15% Microsoft.
| Issuer | Direct | From SPY | Look-through total |
|---|---|---|---|
| NVIDIA | 20.00% | 50% × 7.58% = 3.79% | 23.79% |
| Apple | 15.00% | 50% × 6.66% = 3.33% | 18.33% |
| Microsoft | 15.00% | 50% × 4.91% = 2.46% | 17.46% |
The account says "20% NVIDIA". The real figure is almost 24%, and the three largest companies together are 59.58% of the money. Half of the account sits in a 500-stock fund, yet three companies carry about six-tenths of the outcome.
Step 3: Add up industry exposure
Company names hide industry overlap. NVIDIA is a semiconductor company, Apple sits in technology hardware, Microsoft in software, and the S&P 500 already holds a lot of all three.
SPY's semi-annual report includes an industry breakdown table. Here is the top of it, as filed:
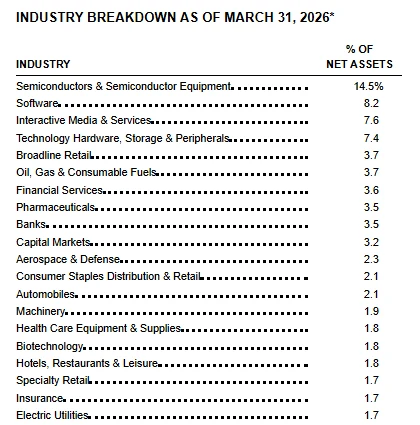
Apply the same look-through arithmetic, by industry:
| Industry | Direct | From SPY | Total |
|---|---|---|---|
| Semiconductors | 20% (NVIDIA) | 50% × 14.5% = 7.25% | 27.25% |
| Software | 15% (Microsoft) | 50% × 8.2% = 4.10% | 19.10% |
| Technology hardware | 15% (Apple) | 50% × 7.4% = 3.70% | 18.70% |
Those three industries add up to 65.05% of the account. A single shock to chip demand or technology spending would hit most of it at once.
One caution: the report's table uses industries, a finer level than the eleven broad sectors you see on most market websites. Use one classification system for everything in your sheet, or the totals will not add up correctly.
Step 4: Count your "effective" number of holdings
Counting positions tells you little when weights are uneven. A more honest single number is the effective number of holdings:
Effective number = 1 ÷ (sum of every weight squared), with weights written as decimals.
The sum of squared weights is the Herfindahl-Hirschman Index, the same measure competition authorities use for market concentration. Ten equal positions give exactly 10. Large positions pull the number down quickly.
- SPY on its own, by issuer: about 47.7. Five hundred names, but they behave like fewer than fifty equal-weighted ones, because the largest weigh so much more than the smallest.
- The example account, looked through to company level: about 8.1.
- The same account if you treat SPY as one block and ignore what is inside: about 3.0.
The 3.0 is too pessimistic and the "500 stocks" feeling is too optimistic. The look-through 8.1 is the useful one: this account behaves roughly like a portfolio of eight equal positions.
Step 5: Test a change before you make it
The value of the sheet is in testing a change before you trade. Suppose you move to 70% SPY and 10% each in NVIDIA, Apple and Microsoft, using the same March 31, 2026 SPY weights:
| Measure | 50/20/15/15 | 70/10/10/10 |
|---|---|---|
| NVIDIA, look-through | 23.79% | 15.30% |
| Semiconductors, total | 27.25% | 20.15% |
| Effective number of holdings | 8.1 | 14.9 |
Neither version is "right". The point is that you can see what you are choosing. If you want a large bet on one company, size it on purpose. How much you can afford to lose on any single position is covered in our guide to turning risk per trade into a share count.
How much concentration is too much?
There is no universal limit for an individual investor, and this guide does not set one. Two published reference points give useful context:
- Under Section 5(b)(1) of the US Investment Company Act of 1940, a fund can call itself "diversified" only if at least 75% of its assets are in cash, government securities, other funds, or holdings that are each no more than 5% of its assets and 10% of the issuer's voting shares. By that yardstick, the example account's 23.79% NVIDIA exposure is far outside the definition, and SPY itself held three issuers above 5% on March 31, 2026.
- The fund's own top-ten weight. If an index fund you think of as "broad" has its top ten at 37.90%, as SPY did on that date, you already start with a tilt toward the largest companies before adding any single stock.
Write your own ceiling for one company and one industry into your trading rules, alongside the other limits in our beginner stock trading risk plan, and recheck it on the same day each month or quarter.
Keep the numbers current
Fund weights move with prices and index changes. SPY's NVIDIA weight was 7.58% on March 31, 2026 and 7.52% on June 30, 2026 in the next N-PORT filing. Refresh the fund weights whenever you refresh your own:
- Fund holdings: use the latest Form N-PORT on SEC EDGAR (filed quarterly), the fund's annual or semi-annual report, or the fund manager's daily holdings file. Our ETF due diligence checklist shows where else to look in a fund's documents.
- Your weights: include cash and anything held on other platforms. Concentration is about all of your investable money, not one app.
- Overlap between funds: if you hold two ETFs, run Step 2 for both and add the results. Two "different" large-cap funds can share most of their top ten.
Quick checklist
- Merge share classes and ADRs into one issuer.
- Look through every ETF using its latest published holdings.
- Total your exposure by company and by industry, with one classification system.
- Calculate the effective number of holdings: 1 ÷ sum of squared weights.
- Test a rebalance in the sheet before you place any order.
- Write down a company ceiling and an industry ceiling, and recheck on a fixed date.
Sources (checked October 19, 2026): SPDR S&P 500 ETF Trust, Form N-PORT for the period ended March 31, 2026 (filed May 28, 2026) and for the period ended June 30, 2026 (filed August 28, 2026); SPDR S&P 500 ETF Trust semi-annual report as of March 31, 2026, Industry Breakdown table (Form N-30D, filed May 29, 2026); all via SEC EDGAR. Investment Company Act of 1940, Section 5(b)(1), 15 U.S.C. § 80a-5(b)(1). The example portfolio weights are illustrative; look-through and effective-number figures are our calculations from the filed weights.